Run Edge Vision Inference on Your Own Machines with rstream
Split a Python vision workload between remote devices and a pool of YOLO inference workers, using rstream tunnels for transport, discovery, and failover.
A vision workload often spans two locations: cameras run near the scene, while inference runs on a workstation, a lab server, or another machine with suitable compute. Connecting those locations usually requires a hosted inference API or a private network plus additional service discovery.
Here, devices and workers each run a Python process and use rstream for transport and discovery. Workers join a pool by creating a labeled private tunnel. Devices watch the tunnel registry, dial a worker, and select another when the current worker disappears. Neither role needs a public listener.
The sample includes the mechanisms needed to evaluate this architecture: frame identifiers and monotonic timestamps, an adaptive display buffer, object tracking across frames and worker changes, and an explicit encoding policy between devices and workers. The WebRTC and GStreamer guides cover direct video delivery instead.
rstream examples / python-vision-inferenceOpen the edge vision sample with the device, the worker, and the annotated viewer.Clone the reference implementation:
git clone https://github.com/rstreamlabs/rstream-examples.git
cd rstream-examples/python-vision-inference
Architecture
The sample has two roles connected through rstream. The worker loads a YOLO model and creates a private tunnel labeled role=inference. Each session starts with a hello advertising the model, input size, and supported codecs, then exchanges framed images for JSON detections. The device captures video, selects an encoding accepted by the worker, keeps up to two frames in flight, and serves the annotated result through a published, optionally token-protected tunnel.
Browser
        |
        | HTTPS, published tunnel (optional --token-auth)
        v
rstream engine
        |
        | routes the viewer to the device
        v
Device (camera + annotated viewer)
        |
        | dials a worker by label, role=inference, over rstream
        v
rstream engine
        |
        | tunnel inventory is the registry; watch tracks the pool
        v
Inference worker (GPU or CPU, advertised by labels)
The browser reaches the device over the published viewer tunnel. The device reaches a worker over a private dial, and detections return on that same stream. Neither process opens an inbound port on its local network.
The split between published and private follows the client protocol. The viewer endpoint serves standard browsers, so it is published and protected at the edge. The inference channel is machine-to-machine between two SDK processes, so it stays unpublished and is reached by an rstream dial, as laid out in Private Tunnels.
What makes the pool elastic is that there is no registry service to deploy. The tunnel inventory itself is the registry: workers exist in it exactly as long as they run, labels make them discoverable, and the engine's real-time watch pushes every arrival and departure to the devices.
Prepare the machines
Every machine involved needs an rstream CLI configuration resolving to the same project, following Installation and CLI Workflow. For a first run, rstream login and rstream project use <project-endpoint> on each machine is enough; the security section below tightens this for real deployments.
Both roles need Python 3.10+, but they keep separate environments. The worker installs the YOLO inference stack from worker/requirements.txt; the device installs the capture, viewer, registry, and tracking stack from device/requirements.txt.
make buildThe model is yolov8n, small enough to run usefully on CPU, so the walkthrough works without a GPU and gets faster when one is present.
Run a worker
The worker loads the model, registers itself by creating a labeled private tunnel, and serves sessions as a frame-to-detections function.
engine_region = control.server_details.region or "unknown"
tunnel = await control.create_tunnel(
    name=args.name,
    publish=False,
    labels={
        "role": "inference",
        "model": config.model,
        "device": device,
        "accelerator": accelerator,
        "capacity": str(args.max_sessions),
        "engine_region": engine_region,
    },
)
async for stream in tunnel:
    already_serving = await admission.try_acquire()
    if already_serving is None:
        await reject_session(stream)
        continue
    task = asyncio.create_task(
        serve_session(stream, inference, admission, already_serving, ...)
    )
    tasks.add(task)
    task.add_done_callback(
        lambda finished, active=tasks: _task_finished(finished, active)
    )
The labels are the worker registration. Beyond role, each worker advertises its model, execution device (cpu, mps, or cuda:0), and accelerator name. The worker selects CUDA when available, then Apple MPS, then CPU, unless --device overrides that choice. The viewer can therefore show the active hardware directly from tunnel inventory.
Workers remain stateless. Tracking, latency estimation, and display buffering stay on the device, so another worker can continue the session after a failure.
make run-workerStart a second worker on another machine, or the same one, and the pool has two members.
Run the device
The device owns the system's state, composed as concurrent loops on one event loop: capture, registry, inference, and rendering. The registry loop is where rstream acts as the signaling layer, seeding the pool from the inventory and keeping it current from the real-time watch.
WORKER_FILTERS = rstream.TunnelFilters(labels={"role": "inference"})

for tunnel in await client.list_tunnels(filters=WORKER_FILTERS):
    if tunnel.properties.name and tunnel.status == "online":
        state.workers[tunnel.properties.name] = tunnel.status
        state.worker_labels[tunnel.properties.name] = dict(tunnel.properties.labels)
async with client.watch(tunnels=WORKER_FILTERS) as events:
    async for event in events:
        ...  # add on tunnel.created, drop on tunnel.deleted
The inference loop picks a worker, dials it by name, and keeps at most two frames in flight so transfer overlaps inference. Since the device always sends its most recent frame rather than a backlog, backpressure is automatic: a CPU worker lowers the detection rate, a GPU worker raises it, and no queue builds anywhere. Failure handling is the same loop. A dial error, a response timeout, or a watch event removing the current worker all put the worker on a short cooldown and pick another.
Load distribution uses rendezvous hashing to give each device a stable preference order over the pool. The device opens sessions to its two preferred candidates, compares the active session count reported in each hello, and keeps the less loaded worker. When the pool becomes empty, detection pauses and resumes when a worker returns.
Automatic selection is the default. Clicking a worker in the viewer pins the session to that worker. If it disappears, the device temporarily returns to automatic selection and uses the pinned worker again when it comes back.
Start the device where the camera is. The default source downloads a short highway-traffic clip on first run, dense enough that the model has fifteen or more vehicles per frame to find, so the walkthrough is reproducible without hardware.
Use the first local camera with:
make run-device ARGS="--source 0"Run the reproducible sample clip with:
make run-deviceThe device prints its viewer address. The page shows the annotated stream and the full telemetry, source and detection FPS, inference time, network time, display buffer, and uplink bandwidth, with a button that disables and re-enables detection while the video keeps playing. The viewer is published, so anyone with the URL can also press that button; --token-auth puts the whole page, controls included, behind edge token authentication.
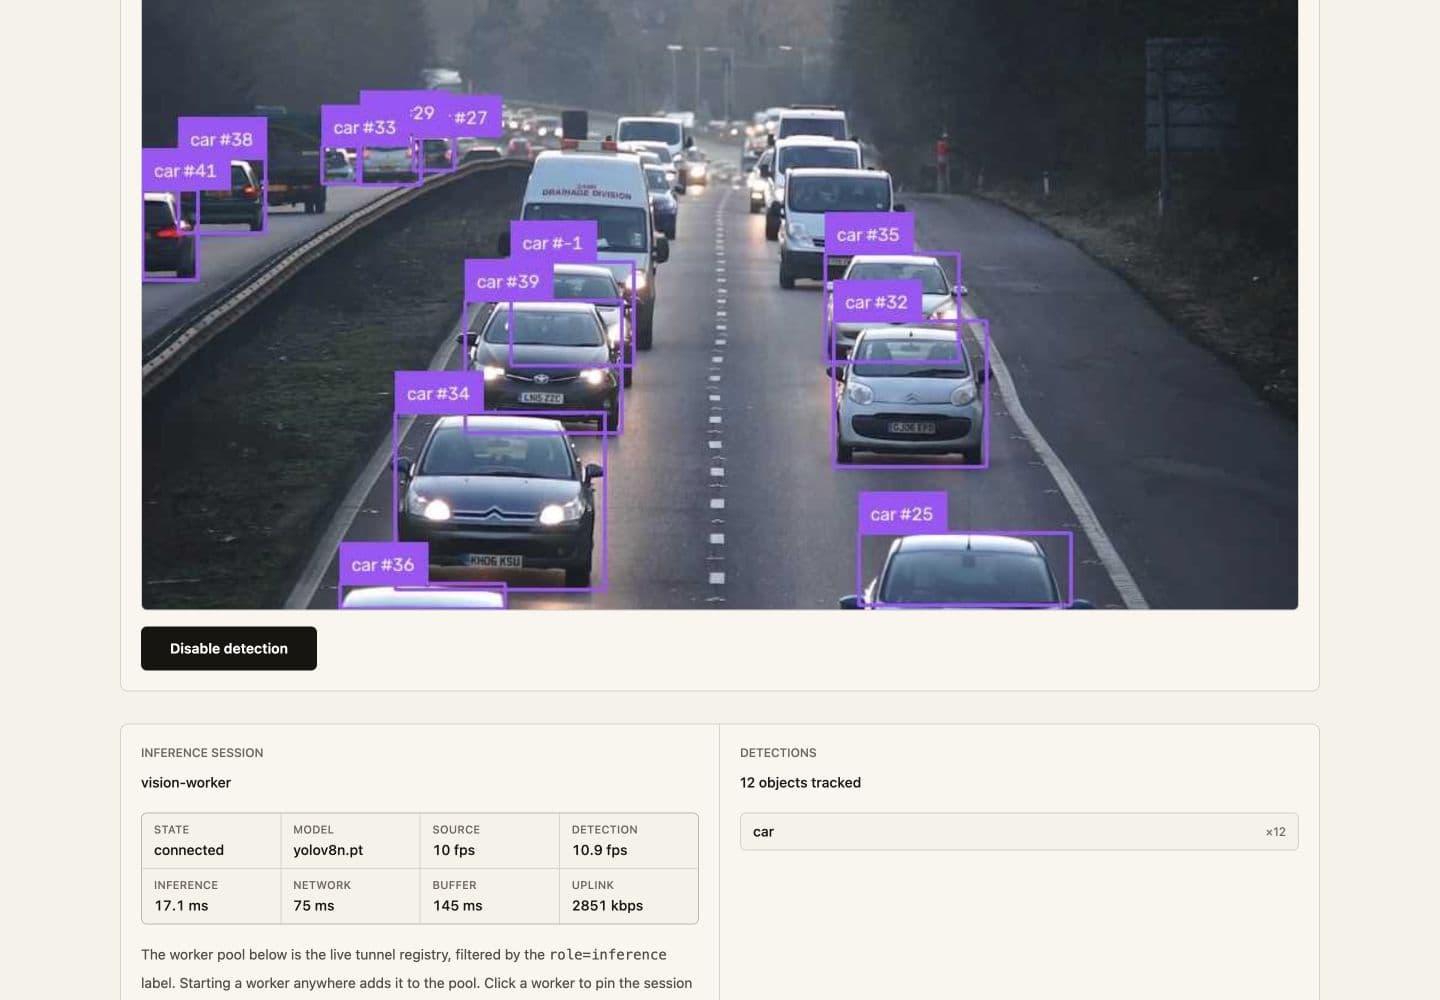
The viewer keeps the video, tracked detections, worker selection, and transport timing in one runtime view.
Timestamps without trusted clocks
Every frame leaves the device with a frame_id and a timestamp from the device's monotonic clock, and every result echoes the frame_id. The worker reports inference time as a duration. The device measures the full round trip on its own clock and derives the network share from those two durations, without comparing clocks across machines.
A jitter buffer for the display
While detection runs, the sample delays display long enough to pair a frame with the detections carrying the same frame_id. With detection disabled, frames display immediately. The delay target follows the smoothed round trip and its variance, within configured bounds, and appears as Buffer in the viewer.
The browser applies a second buffer to timestamped JPEG frames to absorb variation on the viewer path. A ByteTrack tracker on the device carries object identities between detection results. When results become stale after a worker loss or detection is disabled, the overlay disappears while video continues.
An encoding policy for inference traffic
The device resizes each frame to the input size advertised in the worker hello before encoding it. The default is JPEG at quality 80. The viewer reports the measured uplink rate so quality can be adjusted against the actual workload.
--quality adjusts JPEG or WebP compression. --codec png selects lossless frames at a higher bandwidth cost. Stateful video compression could reduce bandwidth further, but it would require decoder state on each worker and would change the failover model used by this sample.
An existing Triton, KServe, or other model server can sit behind the same private tunnel and labels, but the device must use that server's protocol or an adapter. The sample's framed image protocol is specific to worker/worker.py.
Observe worker failover
With two workers in the pool and the viewer open, stop the worker currently serving the device.
The video keeps playing because display is decoupled from inference. The pool loses the stopped worker when the engine emits tunnel.deleted, the active session reconnects, and detections resume from another worker. The tracker remains on the device, so object identities can survive the worker change. Starting the stopped worker again adds it back to the pool without restarting the device.
The same labeled inventory and watch stream handle worker arrival, removal, and selection. Display continuity comes from keeping capture and tracking on the device.
Security postures
Two credential postures fit this architecture; the application code is unchanged.
For a trusted setup, a lab, a homelab, or a single-team deployment, every machine uses a project-scoped credential from the remote device path in CLI Workflow. All members of the project can create and dial tunnels within it, which matches how the machines are actually trusted.
For a hardened deployment, mint separate worker and device tokens. Workers only need to create and delete inference tunnels. Devices need to create the viewer tunnel and connect to workers labeled role=inference. Fine-grained tokens documents complete resources.tunnels boundaries for those operations.
Run it in production
Run both roles as long-lived services with a restart policy and a project-scoped token context. Use fleet names such as worker-gpu-lab-1 and cam-gate-3.
Both roles recreate their tunnels with capped backoff when the engine connection drops. The device resolves one generated viewer hostname at startup and reuses it across reconnects. That generated address changes after a full process restart; --host selects a fixed hostname that also survives restarts, as documented in Stable Domains.
The pool shown by the device, rstream tunnel list filtered by label, and rstream events all read the same tunnel inventory.
The latency breakdown in each viewer separates inference time from network time. When inference dominates the round trip, another worker can be added to the pool without changing the devices.
Where to go next
The SDK fundamentals used here, in-process ASGI serving, private dials, and edge token policy, are introduced on a single app in Serve a FastAPI App through rstream Tunnels. The inventory and watch surface is documented in Python SDK. For delivering the camera itself rather than detections, the media path guides start at Stream Video with GStreamer and rstream, and browser-scale delivery is the WebRTC series starting at Build Device-to-Browser Video Streaming with WebRTC and rstream.
For a camera protocol, model runtime, scheduling policy, or deployment topology tailored to your product, contact us.
Technical qualification
We pin the model and reference video, compare real detections, and exercise malformed frames, bounded admission, cancellation, and capture teardown. The live profile saturates one worker, restores its capacity, then terminates it during an active stream.
The same frame must be retried on another worker with identical labels, confidence scores, and bounding boxes. A separate routing test presents two equal-capacity workers in reverse order and verifies that measured latency, not registry order, selects the path. The qualification record retains the model, media, timings, and payload comparisons.
Troubleshooting
If no worker is selected, inspect the private tunnel inventory before the camera path. The worker must advertise the expected role, model, codec, and capacity labels in the same project as the device. A visible worker that rejects frames usually indicates an unsupported encoding or exhausted admission limit.
If failover is slow, separate registry removal from request recovery. The active stream should expose EOF or a transport error immediately; the device can then retry the same frame on a surviving worker without waiting for the inventory watch to expire.